GOVERNMENT
OF INDIA
GOVERNMENT
OF INDIA
A Digital India Initiative
GOVERNMENT
OF INDIA


Coronavirus Disease (COVID-19) is an infectious disease caused by a newly discovered Corona Virus. The COVID-19 virus spreads primarily through droplets of saliva or discharge from the nose, when an infected person coughs or sneezes. The best way to prevent and slow down transmission is to protect yourself and others from infection, by washing off your hands frequently either by soap or using a sanitizer, not touching your face and following social distancing guidelines.
The Department of Public Health and Preventive Medicine has been contributing the daily status of COVID-19 (Corona virus Disease) in Tamil Nadu and the same has been uploaded on a daily basis, starting from 16th July 2020 onwards, in the TNOGD portal https://tn.data.gov.in
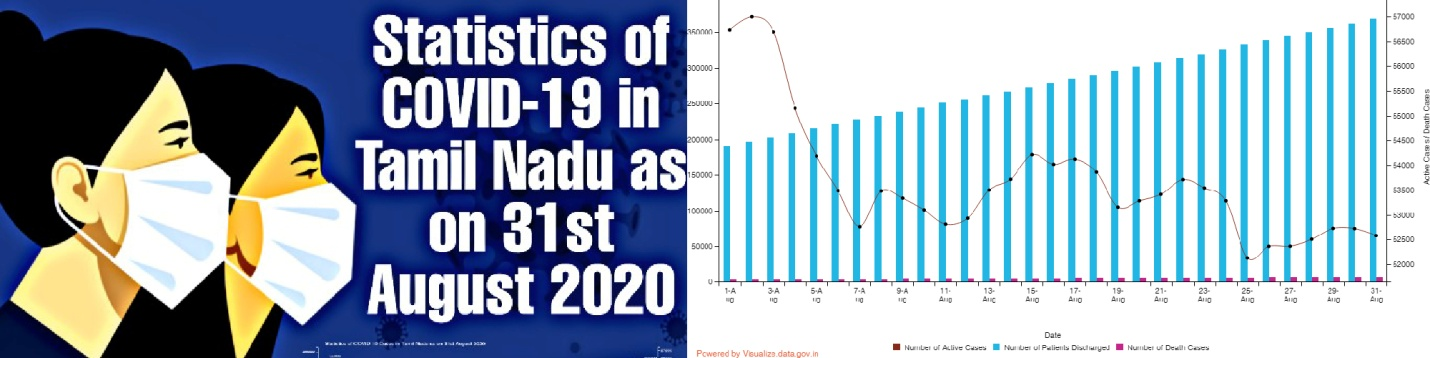
Based on the data provided by Department of Public Health and Preventive Medicine, the Multi-Chart graph showing the Statistics of COVID 19 in Tamil Nadu was created using the Visualization Engine https://visualize.data.gov.in and the graph explains the comparison between Number of Active Cases, Number of Patients Discharged and Number of Death Cases in Tamil Nadu during the month of August 2020.
The URL for the visualization is:
https://visualize.data.gov.in/?inst=zvr1p7srvzefwepm4r21s63zsx2gr69x&vid=100330
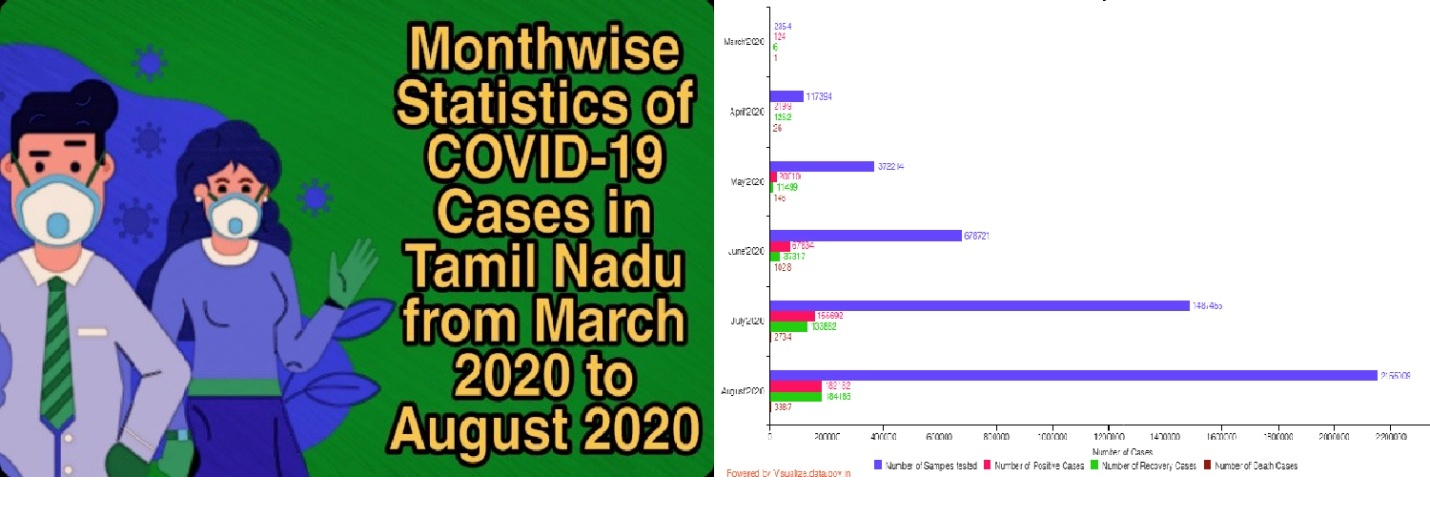
In addition, another graph was created using the same engine showing the Month wise Statistics detailing the Number of Samples tested, Number of Positive Cases, Number of Recovery Cases and Number of Death Cases from March 2020 to August 2020 in Tamil Nadu. It is seen that, there is a rapid increase in all the above cases during this period.
The URL for the visualization is:
https://visualize.data.gov.in/?inst=nwzsngmvfwf1eedwj6pj2w36s747jmmh&vid=100409
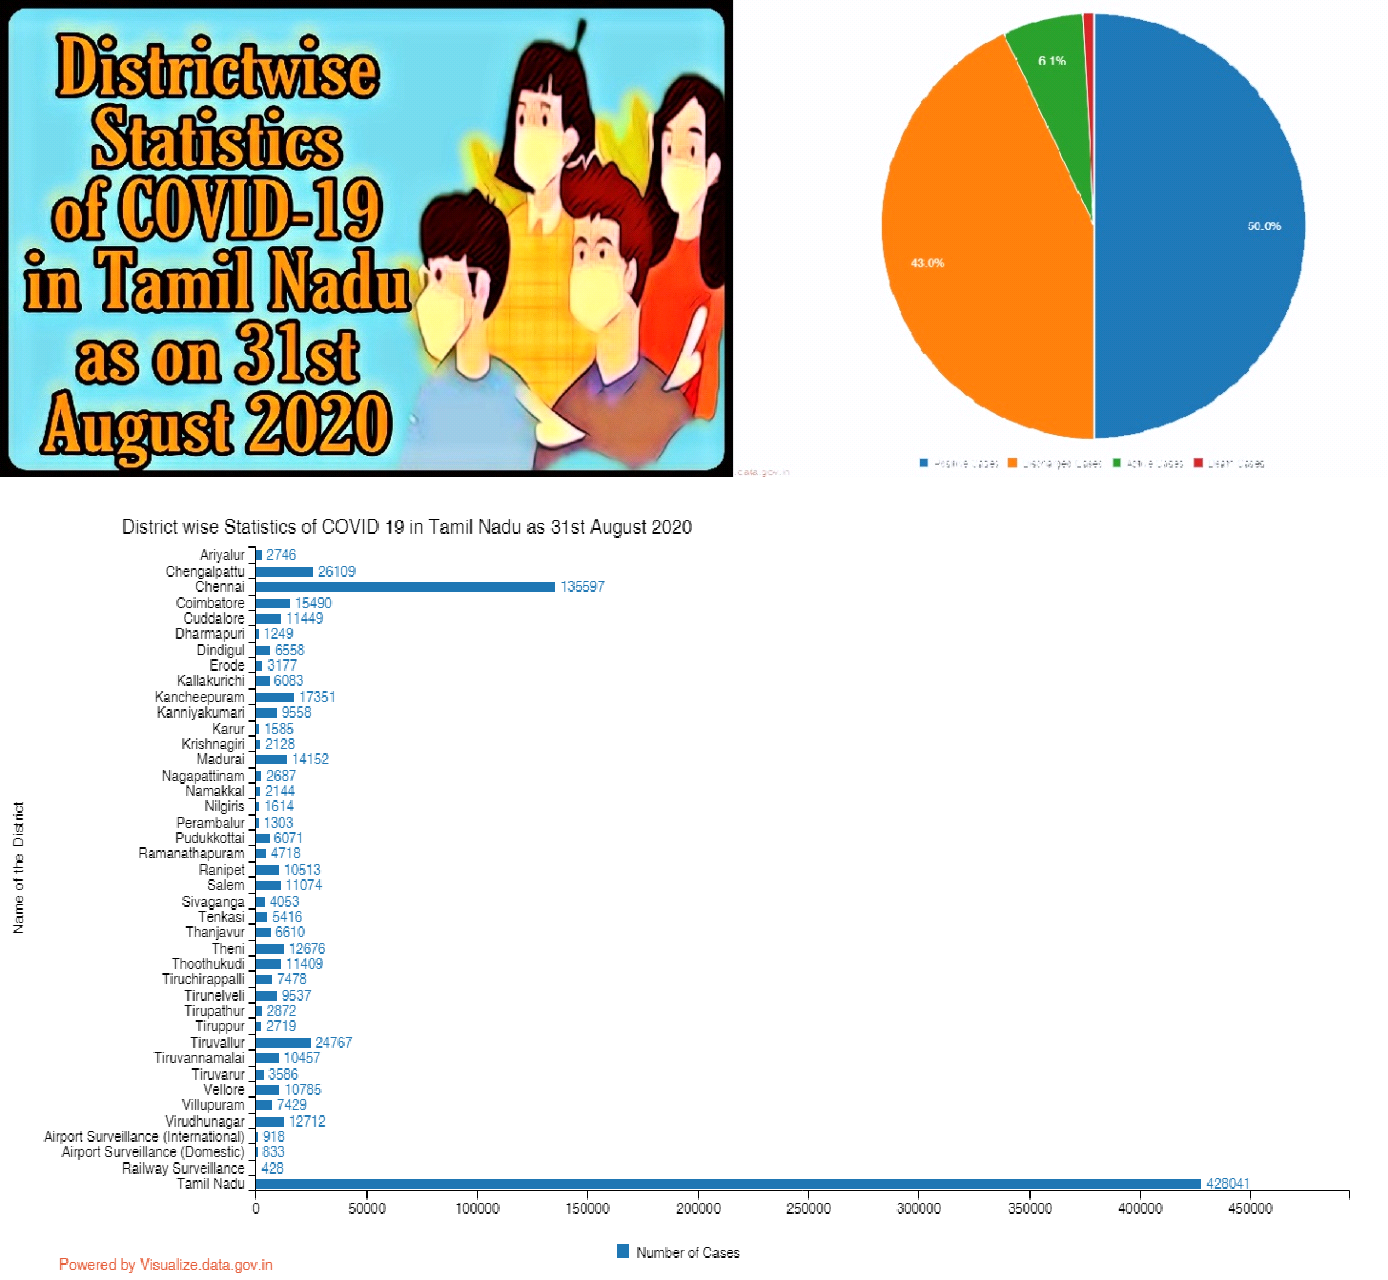
Also, another Drill-Down Chart showing the District wise Statistics of COVID 19 in Tamil Nadu was created using the visualization engine. The outline of the graph is Pie Chart showing 4 major categories namely Overall Positive Cases, Discharged Cases, Active Cases and Number of Death Cases in Tamil Nadu and by selecting the specific category in turn, shows the district wise break up of number of cases in bar chart.
The URL for this visualization is:
https://visualize.data.gov.in/?inst=1lxqibok7s9reghcgh1h6bslflbjj580&vid=100356