 GOVERNMENT
OF INDIA
GOVERNMENT
OF INDIA
A Digital India Initiative
GOVERNMENT
OF INDIA


The receipts of the Government of India are classified under two major categories viz. Revenue Receipts and Capital Receipts. Capital Receipts, in turn, are classified under two major categories viz. Non-debt Receipts (Recovery of Loans; and Other Receipt mainly PSU disinvestment) and Debt Receipts (Borrowings and Other Liabilities).
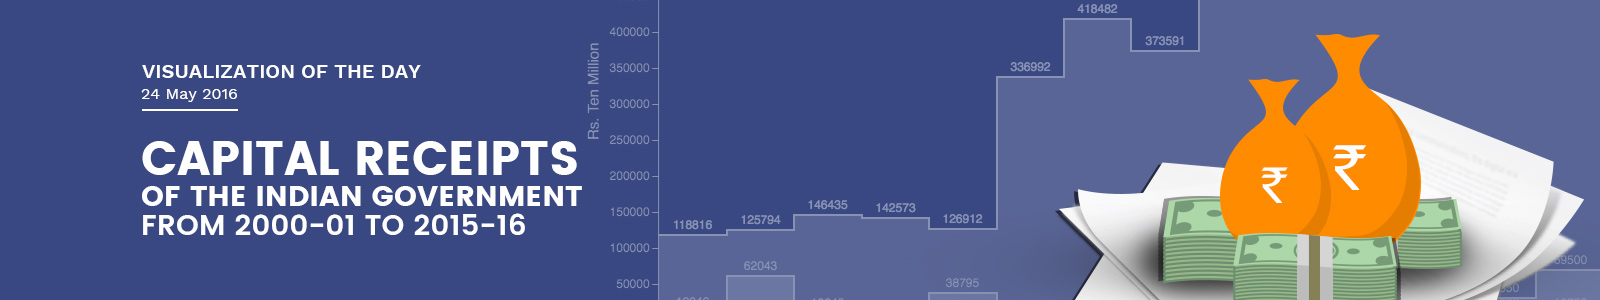
The Capital Receipts of the Government of India was Rs. 132987 crores during the year 2000-01. It increased to Rs. 635902 crores during the year 2015-16 (BE) showing an increase of Rs. 502915 crores during the period from 2000-01 to 2015-16. In percentage terms, the overall growth was 378.17% during the period. The annual rate of growth in percentage terms was 25.21% during the period from 2000-01 to 2015-16.
The Recovery of Loans of the Government of India was Rs. 12046 crores during the year 2000-01. It decreased to Rs. 10753 crores during the year 2015-16 (BE) showing a decrease of Rs. -1293 crores during the period from 2000-01 to 2015-16. In percentage terms, the overall decrease was -10.73% during the period. The annual rate of decrease in percentage terms was -0.72% during the period from 2000-01 to 2015-16.
The Other Receipt (mainly PSU disinvestment) of the Government of India was Rs. 2125 crores during the year 2000-01. It increased to Rs. 69500 crores during the year 2015-16 (BE) showing an increase of Rs. 67375 crores during the period from 2000-01 to 2015-16. In percentage terms, the overall growth was 3170.59% during the period. The annual rate of growth in percentage terms was 211.37% during the period from 2000-01 to 2015-16.
The Borrowings and Other Liabilities of the Government of India was Rs. 118816 crores during the year 2000-01. It increased to Rs. 555649 crores during the year 2015-16 (BE) showing an increase of Rs. 436833 crores during the period from 2000-01 to 2015-16. In percentage terms, the overall growth was 367.66% during the period. The annual rate of growth in percentage terms was 24.51% during the period from 2000-01 to 2015-16.
Note: Data Values are in Rs. Ten Million. BE: Budget Estimates. RE: Revised Estimates. Capital Receipts does not include receipts in respect of Market Stabilization Scheme. Borrowings and other liabilities includes due drawn of cash balance. 1. Direct taxes also include taxes pertaining to expenditure, interest, wealth, gift and estate duty. 2. Major Subsidies excluding grants to NAFED for MIS/PPS. 3. The figures may not add up to the total because of rounding approximations. 4. GDP for BE 2015-16 has been projected at Rs. 14108945 Crore assuming 11.5% growth over the Advance Estimates of 2014-15 (Rs.12653762 crore) release by CSO. Source: Budget documents, Ministry of Finance and also published in statistical year book 2016 by MOSPI.